The State of the Senior Housing Market (Fall 2025)
The senior housing sector in 2025 stands at a point of exceptional strength and renewed confidence. Following years of turbulence, the industry shows sustained momentum and investor conviction. According to NIC MAP (Q2 2025), national occupancy and absorption have rebounded faster than forecast, and the sector’s fundamentals remain “overwhelmingly positive,” as noted in Walker & Dunlop’s 2025 Outlook.
Three converging forces
- Institutional capital is returning, with renewed allocations from REITs and private equity (CBRE 2025 Investor Survey).
- Capital markets have reopened, driven by competitive spreads from the GSEs and life companies.
- Operational performance has stabilized, with margin recovery underway across most regions (JLL 2025 Senior Housing Survey).
Bottom line
Walker & Dunlop, CBRE, and NIC Analytics conclude that aging demographics, minimal new supply, and operational normalization position the sector for multi-year outperformance.
A. Strong Demand & Demographic Tailwinds
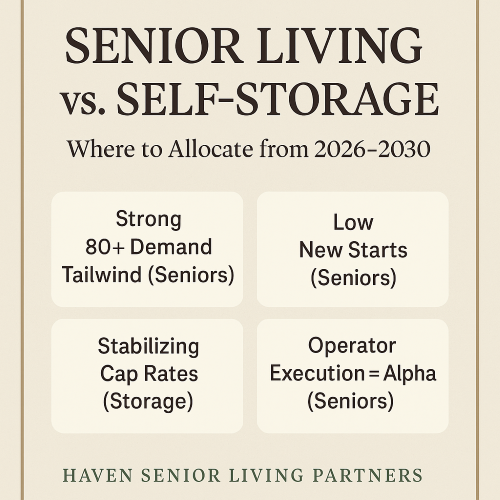
National occupancy reached 88.1% in Q2 2025, matching pre-pandemic levels (NIC MAP, 2025). The U.S. Census Bureau projects that the 80+ population will grow 48% between 2025 and 2030, dramatically expanding the pool of age-qualified households. This momentum, combined with the needs-based nature of senior housing, continues to insulate the sector from broader economic volatility (ULI & PwC, Emerging Trends in Real Estate 2025).
Rents have reached new highs across assisted living and memory care, driven by limited supply and strong absorption (CBRE Seniors Housing Investor Survey, Spring 2025).
B. Supply Constraints & Pipeline
Development remains historically muted. Construction starts are at a decade low due to elevated materials costs, stricter bank underwriting, and zoning friction (Senior Housing News, Aug 2025). Per NIC MAP, new inventory growth is < 2% annually—well under the 4–5% needed to meet forecast demand—an imbalance likely to persist through 2026, favoring existing stabilized assets (Walker & Dunlop 2025).
C. Headwinds & Tailwinds
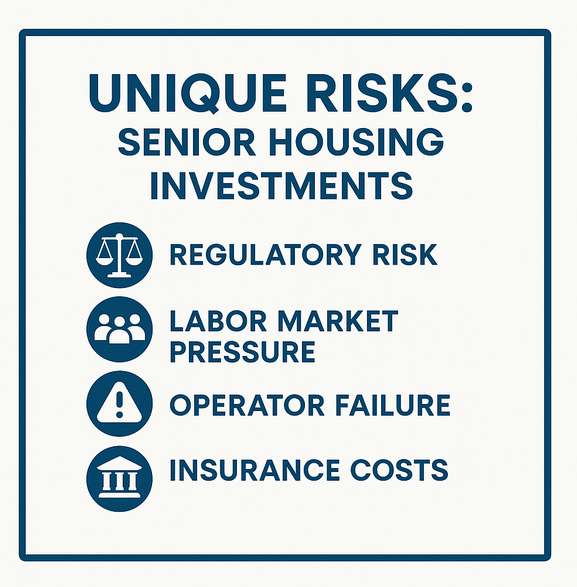
- Affordability pressure
- Medicaid reimbursement uncertainty
- Deferred maintenance needs (LeadingAge & Argentum Workforce Survey, 2025)
- Labor cost stabilization; declining agency reliance (BLS ECI, 2025)
- Insurance premium normalization after 2023–24 volatility (Marsh McLennan Index, 2025)
- Net margin improvement: +120 bps YoY through mid-2025 (NIC)
2025 sales volume rose sharply vs. 2024 as transaction velocity increased ~40% YoY (CBRE 2025). Stabilized Class-A assets in supply-constrained markets remain most sought-after, often attracting 10–15 qualified bids per offering (JLL, Seniors Housing Insight 2025). Prime cap rates have compressed into the low-6% to low-7% range (Walker & Dunlop 2025).
Performance dispersion: “Haves” vs “Have-Nots”
Modern, well-located assets with reputable operators command record valuations; aging or under-managed properties frequently trade below replacement cost (NIC MAP, 2025). Most sales are strategic vs. distressed, with sellers optimizing portfolios and recycling capital. Buyers prioritize cash-flow durability, operator strength, and scalability (CBRE 2025 sentiment).
Financing conditions have markedly improved versus 2024. Fannie Mae and Freddie Mac have re-entered seniors housing with competitive programs, reducing spreads by approximately 25–40 bps for stabilized assets (Freddie Mac Multifamily, 2025). HUD’s Lean Express Lane (2025) expedites low-risk 232 and 223(f) approvals (HUD Bulletin, 2025).
Life companies increased allocations for core seniors housing debt, while bridge lenders and pref equity support recapitalizations and upgrades (Moody’s Analytics CRE Outlook, Q2 2025). Moderating long-term Treasury rates are improving leverage availability and underwriting certainty.
A. Expected Trajectory (2025–2026)
| Key Metric | Expected Trend | Source |
|---|---|---|
| Revenue Growth | Continued rent growth in supply-constrained markets | NIC MAP 2025 |
| Cap Rates | Modest compression for core assets | CBRE Investor Survey, 2025 |
| Liquidity | Expanding via GSE and HUD participation | Walker & Dunlop, 2025 |
| Development | Remains below demand through 2026 | Senior Housing News, 2025 |
Walker & Dunlop forecasts sustained rent growth and suppressed development will keep valuations firm through 2026.
B. Key Strategies for Outperformance
- Prioritize Location & Quality – Durable demand, limited new competition. (CBRE 2025, JLL 2025)
- Scale & Excellence – Operating efficiencies from portfolio growth & branding.
- Value-Add Execution – Target dated properties priced on pre-upgrade NOI. (NIC MAP, 2025)
- Policy Monitoring – Track Medicaid and affordability shifts. (LeadingAge, 2025)
Conclusion: Seniors housing enters 2026 from a position of durable strength. With intensifying demographic tailwinds, decade-low construction, and renewed capital engagement, the sector remains one of CRE’s most compelling opportunities for investors seeking income stability and long-term social impact (PwC & ULI, 2025).
Market Data & Forecasts
- NIC MAP Vision by NIC Analytics (Q2–Q3 2025 Reports)
- U.S. Census Bureau, Population Projections (2024 Revision)
- CBRE Seniors Housing & Care Investor Survey (Spring 2025)
- JLL Senior Housing Investor Survey (2025 Edition)
- Walker & Dunlop Senior Housing Outlook (2025)
- Moody’s Analytics CRE Outlook (Q2 2025)
Operational & Development
- NIC – Market Fundamentals Report, 2025
- Senior Housing News, “Pipeline Declines to Decade Lows,” Aug 2025
- Fannie Mae & Freddie Mac Seniors Housing Program Updates (2025)
- HUD Lean 232/223(f) Bulletins & Lean Express Lane (2025)
Labor, Policy & Costs
- BLS – Employment Cost Index, Healthcare & Social Assistance (2025)
- Argentum & LeadingAge Workforce Surveys (2025)
- Marsh McLennan Insurance Market Index (2025)
Context & Strategy
- NREI – “2025: The Year Seniors Housing Reclaims Momentum,” Jun 2025
- PwC & ULI – Emerging Trends in Real Estate 2025
- Haven Senior Investments Internal Market Intelligence (2025)
📘 Citation Note
All quantitative market data were sourced from NIC MAP, Walker & Dunlop, CBRE, and U.S. Census Bureau as of Fall 2025, unless otherwise specified. Interpretive commentary and synthesis were authored by Haven Senior Investments.


